Mid January 2020 market update
 Strong start to 2020 Condominium Sales in Telluride with Exclusively Real Estate commanding 17% of the dollar volume of condos sold thus far in January.
 Whether you're looking to buy or sell a property in the Telluride area - or find the perfect ski resort rental home or condo, it is important to know what you're up against. In our market, the trend of a low volume of homes and condos on the market compared to the past few years has been fueling an increase in property prices regardless of rising interest rates.
As of November 2018 the number of properties sold is down by 24% compared to 2017 due to the lower inventory, nevertheless, the actual dollar sales volume is down by only a 18%.
| Year | Sales Volume | Number of units sold |
|---|---|---|
| 2017 | $494.9M | 429 |
| 2018 | $410.5M | 328 |
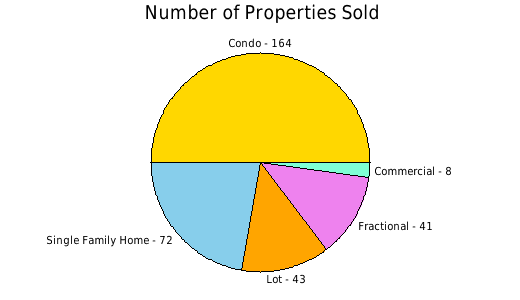
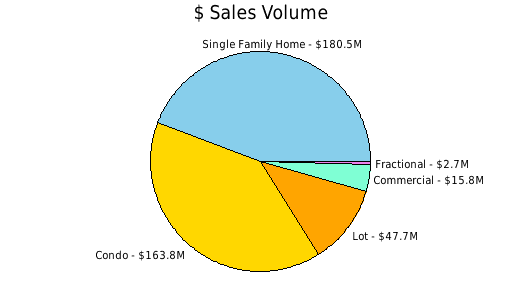
| Property Type | # Sold | $ Sales Volume | ||
|---|---|---|---|---|
| Condos | 164 | 50.0% | $163.8M | 39.9% |
| Single Family Homes | 72 | 22.0% | $180.5M | 44.0% |
| Lots | 43 | 13.1% | $47.7M | 11.6% |
| Fractionals | 41 | 12.5% | $2.7M | 0.7% |
| Commercials | 8 | 2.4% | $15.8M | 3.8% |
| Total | 328 | 100% | 410.5M | 100% |
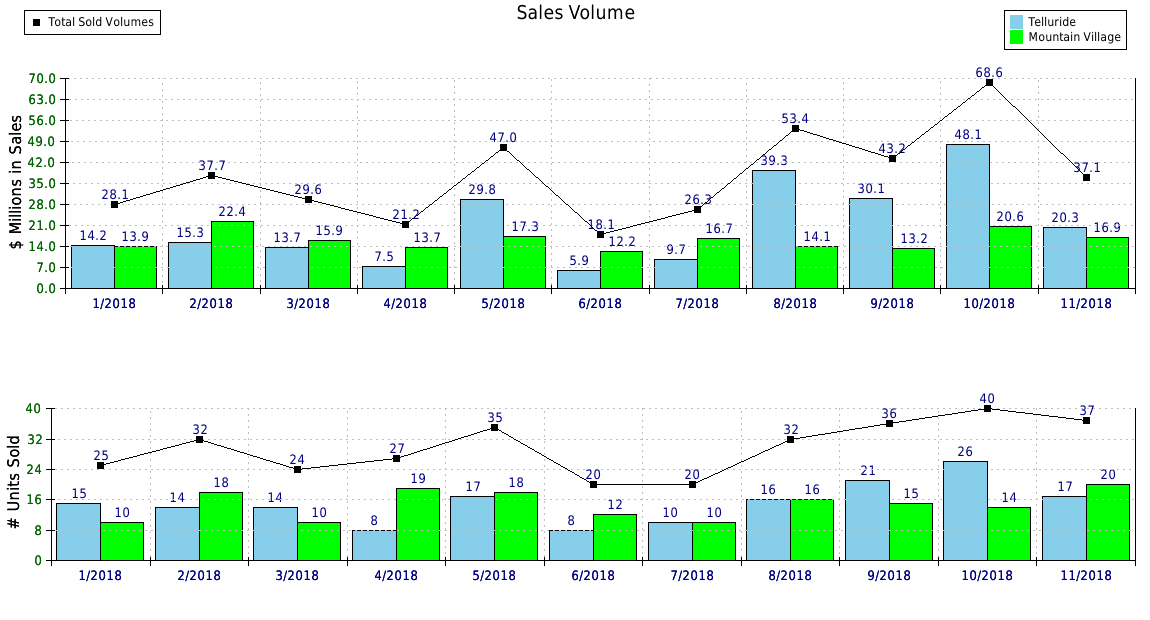
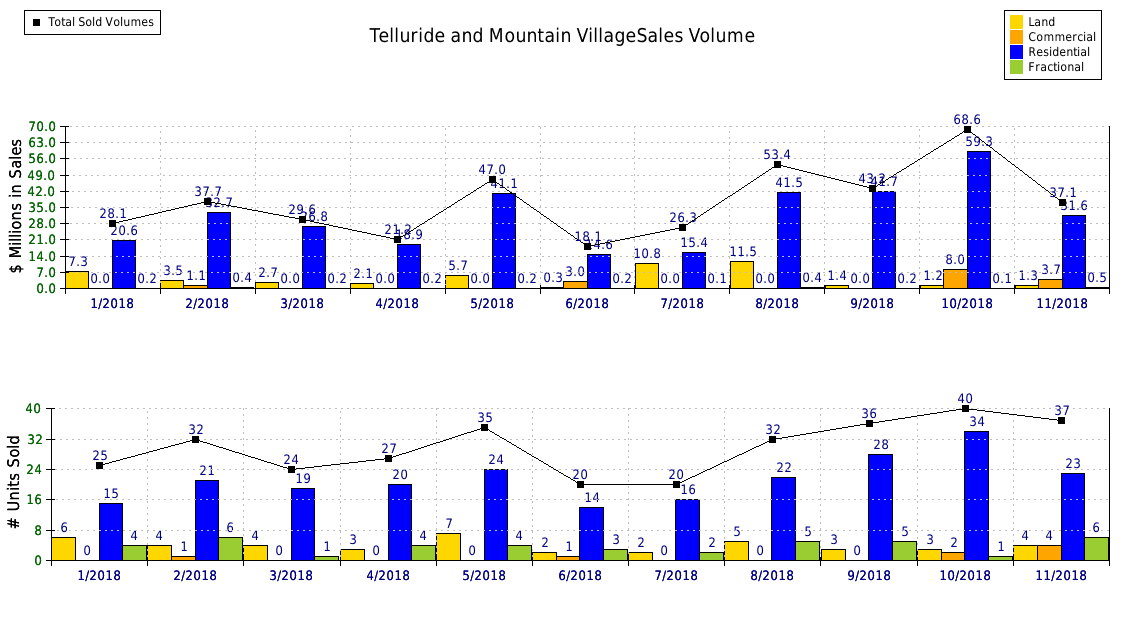
| Month | 2018 | |
|---|---|---|
| Volume | Units | |
| January | $28.1M | 25 |
| February | $37.7M | 32 |
| March | $29.6M | 24 |
| April | $21.2M | 27 |
| May | $47M | 35 |
| June | $18.1M | 20 |
| July | $26.3M | 20 |
| August | $53.4M | 32 |
| September | $43.2M | 36 |
| October | $68.6M | 40 |
| November | $37.1M | 37 |
| YTD Totals | $410.5M | 328 |
| Annual Totals | $410.5M | 328 |
Strong start to 2020 Condominium Sales in Telluride with Exclusively Real Estate commanding 17% of the dollar volume of condos sold thus far in January.